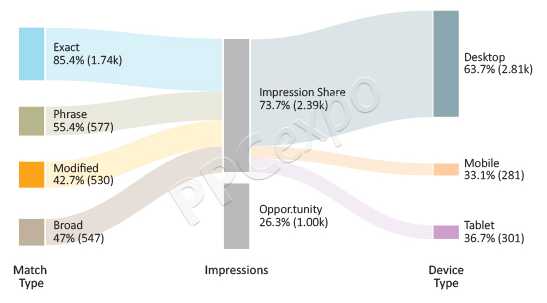
Visualizing Customer Journey with Sankey Diagram
A Sankey diagram is a powerful visualization that provides an overview of the flows in a system, such as energy or materials, or in advertising, the customer journey.
As each flow has a varying height depending on its quantity, analysts can easily determine the most prominent contributions. This type of segmentation analysis makes it easy to draw conclusions from data.
This system is similar to an alluvial diagram, although the latter typically visualizes change over time, rather than depicting changes in several different variables.
Learn More: https://ppcexpo.com/blog/visua....lizing-customer-jour
Me gusta
Comentario
Compartir